
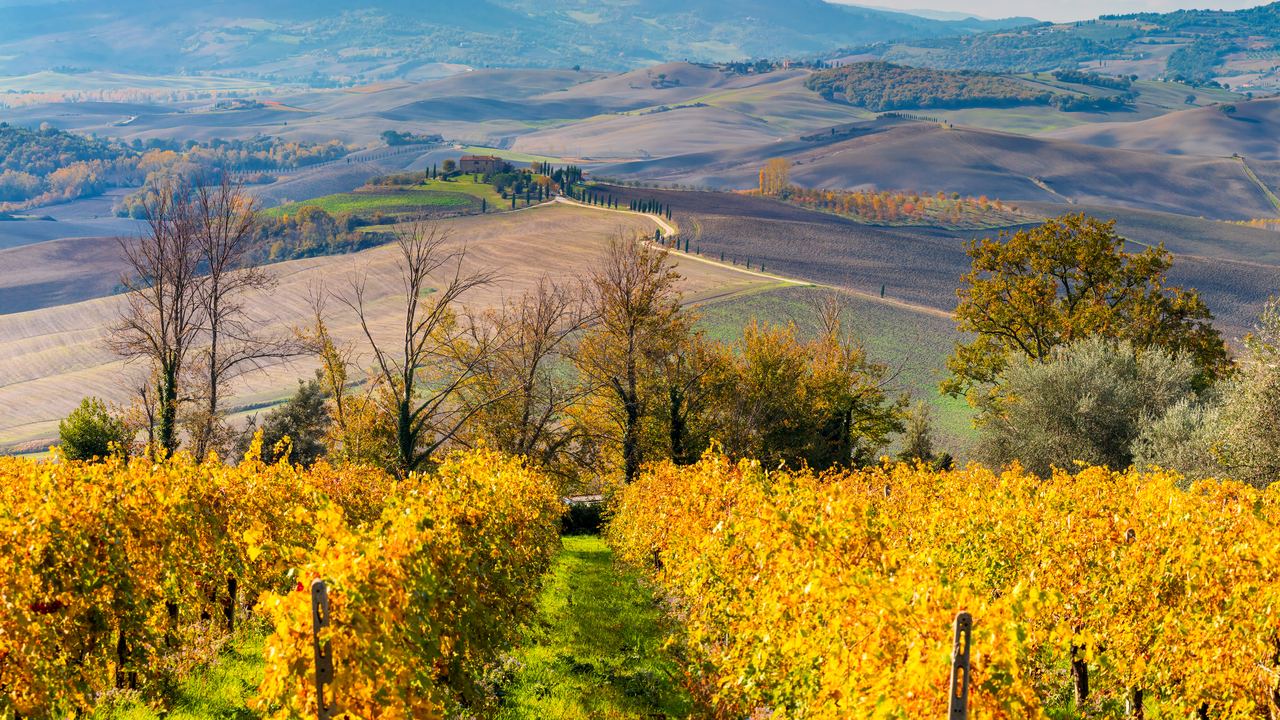
April is mild and dry in 25 of the 28 wine regions we could measure. July, the month most northern travelers book, is mild and dry in nine. That gap is the reason this page exists: the summer holiday and the pleasant weather overlap far less than the brochures suggest, and the regions where they do overlap are not the ones you would guess.
The two matrices below put every region on one grid, one row per destination and one column per calendar month. A month is marked mild and dry when the average daily high is between 15 and 29 C and the month brings less than 80 mm of rain. Anything hotter than 33 C, colder than 10 C or wetter than 120 mm is marked hot, cold or wet, and that rule wins over every other. The rest is workable. The grid measures climate. It does not know when the grapes come in, when the cellar doors are crowded or when they are shut.
We built it from official 1991-2020 climate normals, 28 destinations out of 29. Santorini is missing because the Greek weather service does not publish monthly rainfall for it. Details on that, and on the stations we had to borrow, are further down. Click any row to open the destination page.
When to go: Northern Hemisphere
Months are numbers: 1 is January. Each row is one wine region; click it for the destination page.
| Month | 1 | 2 | 3 | 4 | 5 | 6 | 7 | 8 | 9 | 10 | 11 | 12 |
|---|---|---|---|---|---|---|---|---|---|---|---|---|
| TuscanyJan highs under 10 C; Nov rain of 120 mm or more. Siena stands in for the region; the Maremma coast is milder and drier. | 1 | 2 | 3 | 4 | 5 | 6 | 7 | 8 | 9 | 10 | 11 | 12 |
| ChiantiJan highs under 10 C; Nov rain of 120 mm or more. Reading taken at Siena, on the same hills. | 1 | 2 | 3 | 4 | 5 | 6 | 7 | 8 | 9 | 10 | 11 | 12 |
| VenetoDec-Feb highs under 10 C. | 1 | 2 | 3 | 4 | 5 | 6 | 7 | 8 | 9 | 10 | 11 | 12 |
| Langhe & BaroloDec-Feb highs under 10 C. Nearest official station sits in the same Piedmont foothills. | 1 | 2 | 3 | 4 | 5 | 6 | 7 | 8 | 9 | 10 | 11 | 12 |
| CampaniaNov rain of 120 mm or more. Reading taken on the Volturno plain; the Irpinian hills run cooler. | 1 | 2 | 3 | 4 | 5 | 6 | 7 | 8 | 9 | 10 | 11 | 12 |
| SicilyJul-Aug highs above 33 C. Reading taken on the Catania plain; Etna's upper vineyards run cooler. | 1 | 2 | 3 | 4 | 5 | 6 | 7 | 8 | 9 | 10 | 11 | 12 |
| ChampagneNov-Feb highs under 10 C. | 1 | 2 | 3 | 4 | 5 | 6 | 7 | 8 | 9 | 10 | 11 | 12 |
| BordeauxNo month is hard. Not quite mild and dry: cool (10-15 C) in Nov-Feb, wet (80-120 mm) in Sep-Oct. | 1 | 2 | 3 | 4 | 5 | 6 | 7 | 8 | 9 | 10 | 11 | 12 |
| BurgundyNov-Feb highs under 10 C. Reading taken at Dijon, just north of the Cote d'Or. | 1 | 2 | 3 | 4 | 5 | 6 | 7 | 8 | 9 | 10 | 11 | 12 |
| ProvenceNo month is hard. Not quite mild and dry: hot (29-33 C) in Jul-Aug, cool (10-15 C) in Dec-Feb, wet (80-120 mm) in Sep. | 1 | 2 | 3 | 4 | 5 | 6 | 7 | 8 | 9 | 10 | 11 | 12 |
| Rhone ValleyNo month is hard. Not quite mild and dry: hot (29-33 C) in Jul-Aug, cool (10-15 C) in Nov-Feb, wet (80-120 mm) in Sep-Oct. | 1 | 2 | 3 | 4 | 5 | 6 | 7 | 8 | 9 | 10 | 11 | 12 |
| Douro ValleyJul-Aug highs above 33 C. Reading from a hot inland valley; upland towns such as Vila Real are cooler and wetter. | 1 | 2 | 3 | 4 | 5 | 6 | 7 | 8 | 9 | 10 | 11 | 12 |
| Lisbon & ArrabidaNo month is hard. Not quite mild and dry: hot (29-33 C) in Jul-Aug, wet (80-120 mm) in Oct-Jan. Reading taken at Setubal; Lisbon itself is a little cooler in summer. | 1 | 2 | 3 | 4 | 5 | 6 | 7 | 8 | 9 | 10 | 11 | 12 |
| RiojaNo month is hard. Not quite mild and dry: hot (29-33 C) in Jul-Aug, cool (10-15 C) in Nov-Feb. | 1 | 2 | 3 | 4 | 5 | 6 | 7 | 8 | 9 | 10 | 11 | 12 |
| Penedes & PrioratNo month is hard. Not quite mild and dry: hot (29-33 C) in Jul-Aug. Reading taken at Reus; the Barcelona side of the Penedes is a little cooler. | 1 | 2 | 3 | 4 | 5 | 6 | 7 | 8 | 9 | 10 | 11 | 12 |
| KakhetiDec-Feb highs under 10 C. | 1 | 2 | 3 | 4 | 5 | 6 | 7 | 8 | 9 | 10 | 11 | 12 |
| Napa & SonomaDec-Feb rain of 120 mm or more. | 1 | 2 | 3 | 4 | 5 | 6 | 7 | 8 | 9 | 10 | 11 | 12 |
| Niagara-on-the-LakeNov-Mar highs under 10 C. Reading taken at Vineland, a nearby Niagara Peninsula station. | 1 | 2 | 3 | 4 | 5 | 6 | 7 | 8 | 9 | 10 | 11 | 12 |
| Okanagan ValleyNov-Feb highs under 10 C. | 1 | 2 | 3 | 4 | 5 | 6 | 7 | 8 | 9 | 10 | 11 | 12 |
Climate only, from 1991-2020 official normals: not harvest, crowds or closures. Mild and dry = highs 15-29 C, under 80 mm of rain.
When to go: Southern Hemisphere
Same numbers, opposite seasons: January is midsummer here. Marlborough uses an older normal, 1981-2010.
| Month | 1 | 2 | 3 | 4 | 5 | 6 | 7 | 8 | 9 | 10 | 11 | 12 |
|---|---|---|---|---|---|---|---|---|---|---|---|---|
| MendozaNo month is hard. Not quite mild and dry: hot (29-33 C) in Nov-Feb. | 1 | 2 | 3 | 4 | 5 | 6 | 7 | 8 | 9 | 10 | 11 | 12 |
| Maipo & Casablanca ValleysNo month is hard. Not quite mild and dry: hot (29-33 C) in Jan-Feb. Reading taken near Santiago; coastal Casablanca is cooler and wetter. | 1 | 2 | 3 | 4 | 5 | 6 | 7 | 8 | 9 | 10 | 11 | 12 |
| Cape WinelandsNo month is hard. Not quite mild and dry: wet (80-120 mm) in Jun-Jul. Coastal Cape Town airport; inland valleys run warmer in summer. | 1 | 2 | 3 | 4 | 5 | 6 | 7 | 8 | 9 | 10 | 11 | 12 |
| Hunter ValleyNo month is hard. Not quite mild and dry: hot (29-33 C) in Dec-Feb. | 1 | 2 | 3 | 4 | 5 | 6 | 7 | 8 | 9 | 10 | 11 | 12 |
| Barossa ValleyNo month is hard. Not quite mild and dry: hot (29-33 C) in Jan-Feb, cool (10-15 C) in Jun-Aug. | 1 | 2 | 3 | 4 | 5 | 6 | 7 | 8 | 9 | 10 | 11 | 12 |
| Yarra ValleyNo month is hard. Not quite mild and dry: cool (10-15 C) in Jun-Aug. | 1 | 2 | 3 | 4 | 5 | 6 | 7 | 8 | 9 | 10 | 11 | 12 |
| Margaret RiverJun-Jul rain of 120 mm or more. Reading taken at Cape Naturaliste; inland vineyards run warmer. | 1 | 2 | 3 | 4 | 5 | 6 | 7 | 8 | 9 | 10 | 11 | 12 |
| MarlboroughNo month is hard. Not quite mild and dry: cool (10-15 C) in Jun-Aug. Uses the older 1981-2010 normal, the only official one found. | 1 | 2 | 3 | 4 | 5 | 6 | 7 | 8 | 9 | 10 | 11 | 12 |
| Waiheke IslandJul rain of 120 mm or more. Auckland airport stands in for the island. | 1 | 2 | 3 | 4 | 5 | 6 | 7 | 8 | 9 | 10 | 11 | 12 |
Climate only, from 1991-2020 official normals (Marlborough 1981-2010): not harvest, crowds or closures. Mild and dry = highs 15-29 C, under 80 mm of rain.
How do we decide that a month is mild and dry?
Two numbers per month and region, nothing else: the average of the daily highs and the total rainfall. Both come from the national weather service's 1991-2020 normals, the 30-year reference period the World Meteorological Organization uses for climate averages. We did not use any single year, and we did not use Wikipedia for a single figure. The files were saved from each agency's page on 2026-09-30 and the classes were computed from them by a script, so every cell can be rebuilt.
Three states, applied the same way everywhere.
| State | Average daily high | Monthly rain |
|---|---|---|
| Hot, cold or wet | Above 33 C or below 10 C | Or 120 mm and more |
| Mild and dry | 15 to 29 C, both ends included | Under 80 mm |
| Workable | Everything else: 10 to 15 C, 29 to 33 C | Or 80 to 120 mm with a mild high |
The order matters, because a month can be warm and wet at once. A 28 C month with 130 mm of rain is not mild and dry, and it is not merely workable either. The first row wins. Run that way, the rule produced no absurd results: a Mediterranean summer at 30 to 32 C comes out workable, not hot. The hot label is reserved for months above 33 C, which in our data means Sicily and the Douro in July and August.
Across the 336 verified cells, 179 are mild and dry, 116 workable and 41 hot, cold or wet.
Read the 80 mm line as a rough edge, not a wall. Langhe in May gets 80.5 mm and is workable. Verona in October gets 79.4 mm and is mild and dry. A gap of 1.1 mm separates two labels.
We tested how fragile the rule is by moving one threshold at a time. Lowering the hot limit from 33 to 32 C changes one cell. Raising the top of the mild band from 29 to 30 C changes eight, and lowering it to 28 C changes 11. Rain is the unstable part: moving the limit from 80 to 100 mm changes 21 cells, and moving it to 60 mm changes 64. The temperature edges are firm. The rain edge is not, so we kept the line at 80 mm and say "under 80 mm" on the page rather than "dry".
I have these dates: which wine regions are mild and dry that month?
Find your month, read across. The count is out of 28 regions, 19 in the north and nine in the south. We calculated each row from the classes in the matrices above, so the table and the grid cannot disagree.
| Month | Regions (of 28) | Mild and dry in |
|---|---|---|
| January | 7 | Sicily, Penedes and Priorat, Cape Winelands, Yarra, Margaret River, Marlborough, Waiheke |
| February | 8 | Sicily, Lisbon and Arrabida, Penedes and Priorat, Cape Winelands, Yarra, Margaret River, Marlborough, Waiheke |
| March | 17 | Sicily, Bordeaux, Provence, Rhone, Douro, Lisbon and Arrabida, Rioja, Penedes and Priorat, Mendoza, Maipo and Casablanca, Cape Winelands, Hunter, Barossa, Yarra, Margaret River, Marlborough, Waiheke |
| April | 25 | Tuscany, Chianti, Veneto, Langhe and Barolo, Campania, Sicily, Champagne, Bordeaux, Burgundy, Provence, Rhone, Douro, Lisbon and Arrabida, Rioja, Penedes and Priorat, Napa and Sonoma, Okanagan, Mendoza, Maipo and Casablanca, Cape Winelands, Hunter, Barossa, Yarra, Margaret River, Marlborough |
| May | 24 | Tuscany, Chianti, Veneto, Campania, Sicily, Champagne, Bordeaux, Burgundy, Provence, Rhone, Douro, Lisbon and Arrabida, Rioja, Penedes and Priorat, Napa and Sonoma, Niagara, Okanagan, Mendoza, Maipo and Casablanca, Cape Winelands, Hunter, Barossa, Yarra, Marlborough |
| June | 19 | Tuscany, Chianti, Veneto, Langhe and Barolo, Campania, Champagne, Bordeaux, Burgundy, Provence, Rhone, Lisbon and Arrabida, Rioja, Penedes and Priorat, Napa and Sonoma, Niagara, Okanagan, Mendoza, Maipo and Casablanca, Hunter |
| July | 9 | Langhe and Barolo, Champagne, Bordeaux, Burgundy, Napa and Sonoma, Niagara, Mendoza, Maipo and Casablanca, Hunter |
| August | 11 | Langhe and Barolo, Champagne, Bordeaux, Burgundy, Napa and Sonoma, Niagara, Okanagan, Mendoza, Maipo and Casablanca, Cape Winelands, Hunter |
| September | 19 | Langhe and Barolo, Campania, Champagne, Burgundy, Douro, Lisbon and Arrabida, Rioja, Penedes and Priorat, Kakheti, Niagara, Okanagan, Mendoza, Maipo and Casablanca, Cape Winelands, Hunter, Barossa, Yarra, Margaret River, Marlborough |
| October | 19 | Veneto, Sicily, Champagne, Burgundy, Provence, Douro, Rioja, Penedes and Priorat, Kakheti, Napa and Sonoma, Niagara, Mendoza, Maipo and Casablanca, Cape Winelands, Hunter, Barossa, Yarra, Margaret River, Marlborough |
| November | 13 | Sicily, Provence, Douro, Penedes and Priorat, Napa and Sonoma, Maipo and Casablanca, Cape Winelands, Hunter, Barossa, Yarra, Margaret River, Marlborough, Waiheke |
| December | 8 | Sicily, Penedes and Priorat, Maipo and Casablanca, Cape Winelands, Barossa, Yarra, Margaret River, Marlborough |
Two patterns stand out. March is the only month in which all nine southern regions are mild and dry, and April is the month with the most regions overall. July is the thinnest month of the northern summer: only six of the 19 northern rows qualify (Langhe, Champagne, Bordeaux, Burgundy, Napa and Niagara). In the other 13, July is workable or hot. If your dates are fixed to July or August, the table is a short list worth reading twice.
If your dates are flexible, the shoulder months do the work. May and September each leave a majority of regions in the mild band, and the table shows which ones drop out.
What do the numbers look like in real regions?
A label hides the figure that produced it. Five regions, read at the station named in the matrix, show what the cells are made of.
Champagne: cool, and rarely wet
At the Bouzy station, at 153 m, Meteo-France's 1991-2020 sheet gives a July high of 25.5 C with 58.5 mm of rain. April to October is mild and dry, seven months in a row. The cold end is the real limit: November averages a 9.6 C high, and December to February are colder still, so those four months fall into the hot, cold or wet band by the 10 C rule, even though December has only 78.4 mm of rain. For Champagne that means a seven-month window, with March as a workable shoulder.
Sicily: the summer that drops out
Sicily is the opposite case. At Catania Sigonella, on the plain, the average high is 34.0 C in July and 34.5 C in August, which puts both above the 33 C line, while January is 15.9 C with 64.1 mm. Eight months are mild and dry: October to December and January to May. June and September are workable, July and August are out. The Enna station, on the interior plateau, gives January highs of 8.4 C, so the island is not one climate, and the row note says so. The Etna vineyards on the Sicily page sit between those two readings, and we have no station for them.
Napa and Sonoma: rain in winter, heat in September
NOAA's normals for Napa State Hospital show January at 126.5 mm, February at 130.3 mm and December at 140.5 mm, which sends the three winter months to the wet band. July and August have highs of 28.5 and 28.7 C and almost no rain (0.0 and 1.5 mm), so both are mild and dry. September is the surprise: the high is 29.1 C, a tenth over the line, and the month is workable. Calistoga, up the valley, averages 31.9 C in July, so the label depends on where in Napa and Sonoma you stand. Our row uses the valley floor station.
Chile: two stations, two answers
Chile shows why the matrix carries a note on every row. The row for Maipo and Casablanca reads Pudahuel airport, near Santiago: January high 30.2 C and 0.3 mm of rain. The check station at Rodelillo, in Vina del Mar and closer to the coast, gives 23.3 C for the same month, which would be mild and dry. In June the two flip the other way: Pudahuel gets 66.5 mm and Rodelillo 161.7 mm. Neither number is wrong. They describe two different places, and an average of the two would describe neither.
Douro: a valley floor against a hill town
For the Douro the matrix uses Mirandela, a hot valley at 250 m, where IPMA's normal gives 33.4 C in July and 33.2 C in August. That is hot. At Vila Real, 561 m up, the same months are 28.8 and 29.0 C, which would pass as mild. Vila Real also gets 129.4 mm in January and 142.8 mm in December, against 62.7 and 69.0 at Mirandela. Neither station is the river. We kept the one that matches the valley floor and put the warning in the note.

What does the matrix not tell you?
Three things you would assume it does, and it does not.
It is not a harvest calendar. The two are different questions and sometimes opposite answers. On our harvest season page, the windows we could confirm from official or consortium pages put Napa and Sonoma in August to October and Champagne in September and October. In the matrix above, Napa's September is workable because of that 29.1 C high, and Champagne's harvest sits inside its mild stretch. The Hunter Valley's harvest runs from the end of January to March, which the matrix labels workable in January and February, because the highs are between 29 and 33 C. A mild month is not a harvest month, and a harvest month is not always a mild one. The harvest page also lists the regions we could not confirm, so those rows are missing there, not estimated.
It is not a crowd or a closure forecast. This is the uncomfortable part. The month with the best weather in a region can be its busiest, and we have no data on it. We also have no data on which cellar doors close for part of the year or shorten their hours at the end of the season, and a mild and dry month does not tell you that the tasting room is open. If one producer is the reason for the trip, ask them before you book. We would rather print that gap than guess at it.
It is not a forecast. A normal is an average over 30 years, and a single May can land far from it. The grid says what is typical, not what will happen on the day, and it counts rain in millimeters, not in rainy days. A month with 70 mm in two storms and one with 70 mm over twelve gray days get the same label. For rain, heat, smoke and snow as risks in their own right, the weather and climate page goes further.
Rule of thumb: use the matrix to remove months, not to pick one. It is good at telling you which months to avoid. It cannot tell you which of the remaining ones is yours.
What if you are traveling from the other hemisphere?
Month numbers mean the same thing everywhere. The seasons do not. January is the middle of summer in the Cape Winelands and the middle of winter in Champagne, and the matrix prints both because the months are numbers, not names.
Look at what that does to a January trip. Only two of the 19 northern rows are mild and dry in January, Sicily and Penedes and Priorat. Five of the nine southern rows are: the Cape Winelands, Yarra, Margaret River, Marlborough and Waiheke. In July it flips. Six northern rows qualify, and three southern ones: Mendoza, Maipo and Casablanca, and the Hunter.
The mistake that follows is packing for your home season. A European arriving at the Cape in July leaves summer and meets an average high of 17.9 C and 84.8 mm of rain at Cape Town airport, which makes the month workable, not mild. In Margaret River the same month is 17.2 C and 142.0 mm, so it falls in the wet band. We do not give harvest or event windows for the southern regions on this page. For those, the harvest page has the months we could verify, and the rest are blank.

Which regions are missing or weaker, and why?
Santorini has no row. The Hellenic National Meteorological Service publishes a 1991-2020 average high for its Santorini station but no monthly rainfall, and the daily-value fields for June to September are empty. The World Meteorological Organization files we used do not include Greece. Without rain we cannot compute the label, and we will not fill the cell with a guess. The Santorini page still exists; it just has no matrix row.
Marlborough is the one row that is not 1991-2020. The only official normal we could open is the 1981-2010 one, published through the WMO World Weather Information Service from New Zealand's MetService. The row note says so.
Thirteen rows use a station that is not inside the wine zone. Among them, Siena stands in for Tuscany and Chianti, Dijon for Burgundy, Mirandela for the Douro, Reus for Penedes and Priorat, Pudahuel for Maipo and Casablanca, Cape Town airport for the Cape Winelands, and Auckland airport for Waiheke. The Cape is the weakest case: it is the only South African Weather Service normal we could open, it is on the coast, and the inland valleys run warmer in summer. We have no official figure for how much warmer. Treat each of those rows as the climate of a nearby station.
Keep planning
The matrix removes months. These pages deal with what is left.
Harvest season by hemisphere
The months we could confirm from official pages, and what you can see during picking.
Weather and climate by wine region
Rain, heat, smoke and snow as risks, with the normals behind them.
Choose your wine region
Start from the city you leave from and find the region that fits.
Plan your wine tour
The order of decisions, from region to booking.
Questions about when to visit wine regions
Which month is mild and dry in most wine regions?
April. In our matrix 25 of 28 regions have an average high of 15 to 29 C and under 80 mm of rain that month. May follows with 24. Kakheti, Niagara and Waiheke drop out in April.
Is summer a good time to visit wine regions?
It depends on the region. July is mild and dry in only nine of 28: Langhe, Champagne, Bordeaux, Burgundy, Napa and Sonoma, Niagara, Mendoza, Maipo and Casablanca, and the Hunter. Sicily and the Douro average above 33 C in July and August.
Which wine regions are mild and dry in winter?
In December, eight: Sicily, Penedes and Priorat, Maipo and Casablanca, the Cape Winelands, Barossa, Yarra, Margaret River and Marlborough. Most of them are in the southern hemisphere, where December is summer.
Does mild and dry mean it is harvest time?
No. The grid measures temperature and rain only. Harvest windows are on our harvest season page, where we list only the regions with an official or consortium source.
Do these months tell me if wineries are open or crowded?
No. We have no data on opening hours, seasonal closures or visitor numbers. A mild month can be the busiest one. Check with the producer for the dates you plan.
Sources and method
Every temperature and rainfall figure is a monthly average from an official 1991-2020 climate normal, except Marlborough (1981-2010). The files were opened and saved from the pages below on 2026-09-30, converted to Celsius and millimeters where the agency uses Fahrenheit and inches, and classified by a script with the three rules shown above. Where a second nearby station disagreed on the class of a month, we kept the reference station and listed the difference in our working file. The agency list below is shortened to one link per source family. Licence terms for reuse differ by agency, and we use monthly averages, not the agencies' tables.
- Meteo-France, climate sheet for Bouzy (Champagne)
- WMO normals 1991-2020 hosted by NOAA, Catania Sigonella (Aeronautica Militare)
- LaMMA Toscana, climatology of Siena
- NOAA NCEI, U.S. Climate Normals, Napa State Hospital
- IPMA, climate normal for Setubal (Douro uses the Mirandela file on the same site)
- WMO normals 1991-2020 hosted by NOAA, Pudahuel (Direccion Meteorologica de Chile)
- WMO normals 1991-2020 hosted by NOAA, Cape Town International (South African Weather Service)
- Environment and Climate Change Canada, climate normals
- Bureau of Meteorology, climate statistics, Cape Naturaliste
- WMO World Weather Information Service, Blenheim (Marlborough)
What we could not confirm: monthly rainfall for Santorini, a 1991-2020 normal for Marlborough, and any figure for visitor numbers, closures or opening hours by month. This page is part of the planning guide.
Data verified on. Climate normals read from agency files saved on this date; the classes are computed from them. Editorial Policy
Wine Tours Editorial earns a commission when you book through links on this page. It does not change the price you pay. See our editorial policy.
Pick the region, then the month
Start from the city you leave from and see which wine region fits the dates you have.